About the 2012 National Health and Nutrition Survey results
With the 2012 National Health and Nutrition Survey, emphasis was placed on understanding regional disparities related to physique and lifestyle habits as well as to the estimate of the number of people suffering from diabetes, which has been performed every five years since 1997. In order to compare the prefectures, the survey targeted household members at least one year old in all households within 10 districts per prefecture (15 districts for Tokyo with high-population)--selected through a stratified random sampling of the 2010 National Census districts that ended with the number [1]--for a total of 475 districts (amounting to about 23,750 households and about 61,000 people over the age of one for the 475 districts).
For the full details of the survey, please seethe Ministry of Health, Labour, and Welfare's 2012 National Health and Nutrition Survey Report.![]() Also, the data used on these maps can be downloaded frome-Stat
Also, the data used on these maps can be downloaded frome-Stat![]() , the portal site for government statistics.
, the portal site for government statistics.
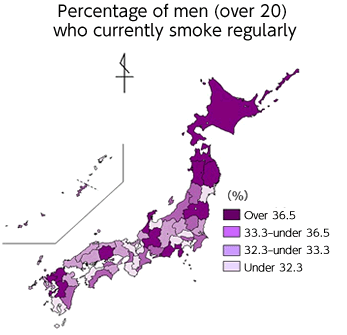
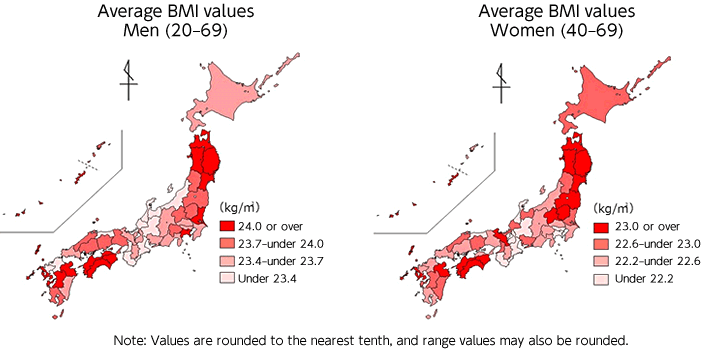
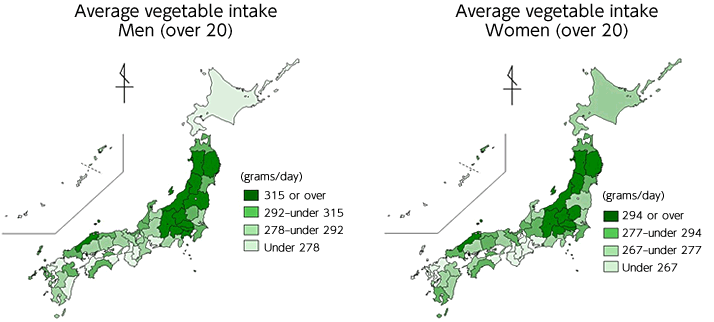
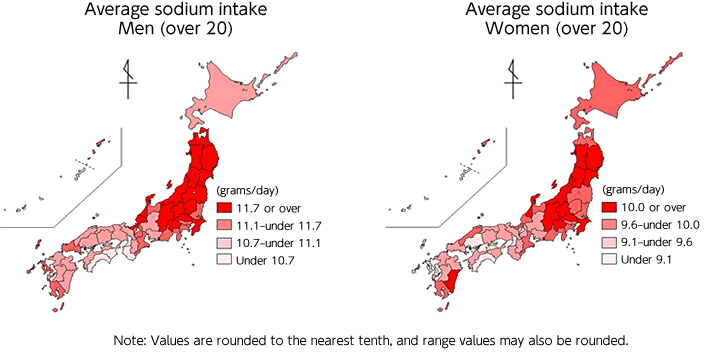
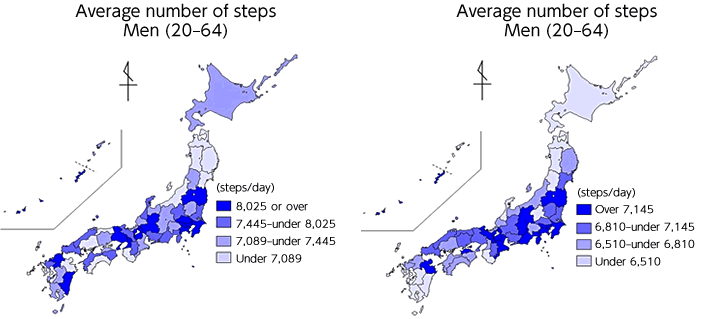
Physique (BMI), vegetable intake, sodium intake, steps, and smoking rate (men only) values for each prefecture have been adjusted for age and sorted according to four ranges, from highest to lowest. The relative error for smoking rates among women was considerably high, so those results are not displayed. Significant variation was not observed between the top 25% and bottom 25% for any of the survey items. Note: Average BMI values and sodium intakes are rounded to the nearest tenth, and their range values may also be rounded.
Average BMI values
Average vegetable intake
Average sodium intake
Average number of steps
Percentage of men (over 20) who currently smoke regularly